WizIQ’s innovative reports and analytics feature gives you an in-depth view of your course performance and lets you tailor your teaching or training methodology accordingly.
Ensure the success of your online course with eLearning analytics
Measuring the results of your eLearning course is as crucial as running one – be it a self-paced or an instructor-led course. eLearning analytics helps you gauge your learners’ progress, highlight the weak areas of your course and plan your future courses based on the results of your current ones. Here are the benefits of using reports and analytics in your online learning course:
- You can manage your class and course logistics easily with detailed attendance and completion reports
- eLearning analytics lets you focus on the sections of your course your learners are struggling with to spot the weak areas of your course
- LMS analytics gives you the option to take result-based corrective measures to increase learner effectiveness
- You can offer personalized learning depending on the performance of your learners and ensure learner satisfaction like never before
- Instead of shooting arrows in the dark, a targeted approach towards teaching saves you cost and efforts
- Prompt feedback derived from the reports helps you predict future class performance and avoid mistakes
How to view eLearning analytics in WizIQ?
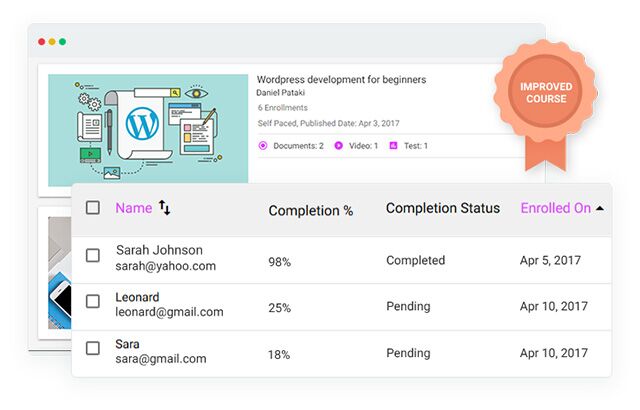
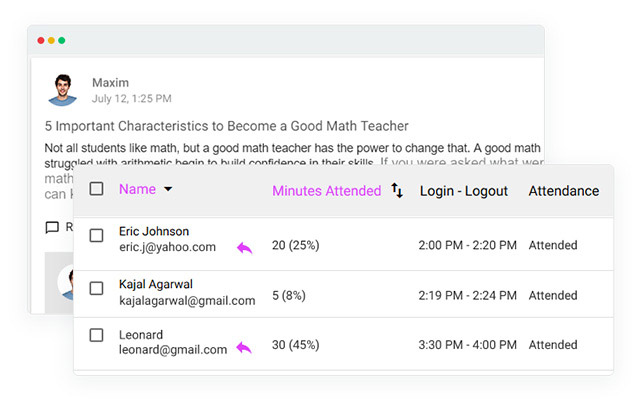
WizIQ gives you detailed insights of your eLearning course with its reports and analytics module. You can view the completion rate, attendance, login logout times and much more with WizIQ. Take a look at the steps involved in checking the analytics of your eLearning course:
- Go to your courses or live classes for which you have to check the analytics
- Once you are on the page, click on ‘Active Courses’ tab
- Select the concerned course and click on the ‘People’ tab
- View course-wise analytics like the names of the attendees, time spent in the class, downloads (if any) and attendance report here
- Filter according to different fields to get targeted results
- Click on ‘EXPORT CSV’ tab to download your report in Excel format for future reference and record-keeping
Deliver result-driven eLearning with WizIQ’s reports and analytics module
Let the results drive your teaching strategy with WizIQ reports and analytics module. One look at your class performance and attendance can give you a ballpark view of how your course is fairing among your learners. With a wealth of analytics data, you can make an informed decision regarding your teaching style, student interaction and eLearning course development. Take a look at what you can do with WizIQ reports and analytics feature:
- View attendance reports
- Assess class performance
- Improve learner retention
- Download reports in Excel format
- Check time spent in class
- Reduce cost and efforts
- Check course-wise performance
- Filter your class data
Improved course content
eLearning analytics is crucial in designing engaging course content. With a glimpse of what works and what doesn’t work with your learners, you can take well-informed decisions backed by data.
- Analyze class performance after every session
- Identify the dips in class engagement and performance
- Work on the weak areas of your course content accordingly
- Include engaging assets (videos, games, impromptu tests, etc.) to increase learner retention

Keep track of learners’ performance
Personalized learning is one of the key benefits of data-driven eLearning, course structure and course content. Let’s see how:
- Identify students with lower attendance rate and take corrective actions
- Monitor learners with lesser than average time spent in class and seek feedback
- Add extra classes for weak students to increase the success rate of your eLearning course
- Enhance your effectiveness as an instructor by focusing on the glitches highlighted by class analytics

Know what works
If you don’t have an idea of how your learners are doing, it will be difficult for you to take decisions regarding which course you should continue with. With WizIQ’s reports and analytics module, you can decide what will work in the future and take relevant decisions.
- Remove non-performing courses from your eLearning course schedule
- Work on the successful courses to make them more appealing by adding new elements
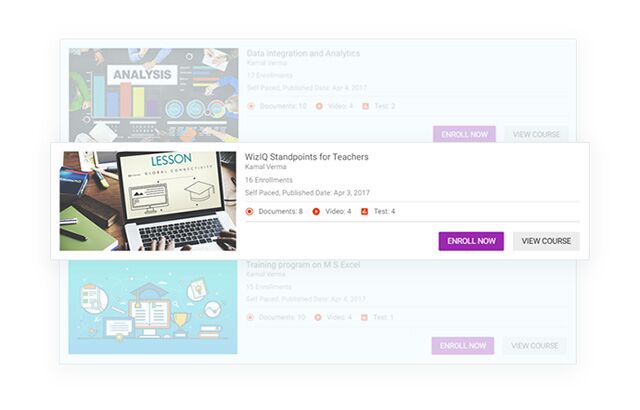
- Add featured courses or classes which are doing well to drive more traffic to your eLearning course
- Modify the content of your existing courses with lesser engagement based on class insights

